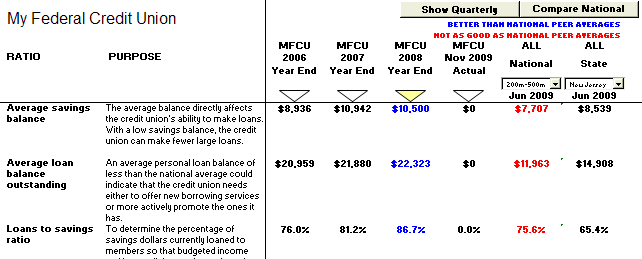
In this sheet, Credit Union ratios are compared to national ratios for credit unions of similar size. These ratios provide a comparison to national averages as a pergentage. They also provide the differences of results of operation (in dollars) between your credit union and an "average" credit union of the same size.
Comparisons to state averages for credit unions of a similar size are also provided. State averages include all credit unions located in the state (and may not be representative of your credit union).

All of the figures on the Ratio Analysis worksheet pull through from the Data entry worksheet. No data entry is necessary in the Ratio Analysis worksheet. You can experiment with comparisons to various peer groups, by asset class and state, by utilizing the drop down boxes located in the far right hand corner of the worksheet.
You can also highlight specific sets of data for comparative purposes, using our Compare features.
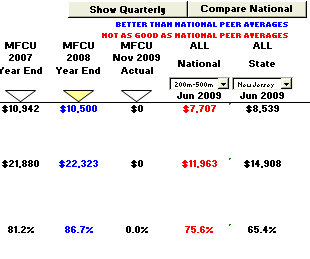
For example, if you toggle the Compare button until you see "Compare National" displayed, Insight will then compare your credit union's data to the National data for the Asset class you have selected.

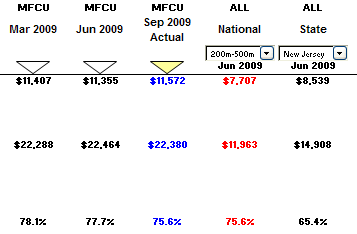
You can also toggle between comparisons of Monthly data, Quarterly data, and Annual data. The ratio data in the software is updated semi-annually.

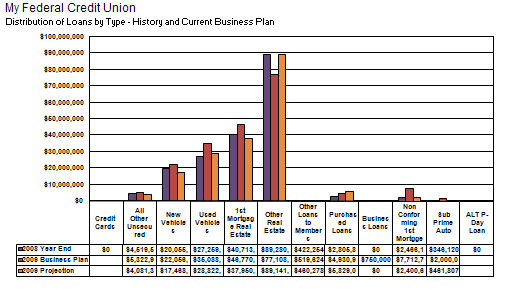
In addition to the RA Chart, Insight comes equipped with a wide array of other charts and graphs designed to help you visualize your credit union's goals, objectives, trends, and history.
