After setting long-term Membership and Productivity Objectives, you can use the Savings Analysis and Loan Analysis charts to project loan and savings growth to the end of the year and/or the next years budget. You can project this growth complete with estimated yields of the various savings and loan types.
On the Savings Analysis chart, you can enter year end goals for all of your Share account balances, including Regular Shares, Money Market accounts, Share CDs, IRA CDs, Premium, Clubs and Escrow balances, non-member funds and more. You can also enter estimated year end yields (average dividend rate) for all of your Share accounts.
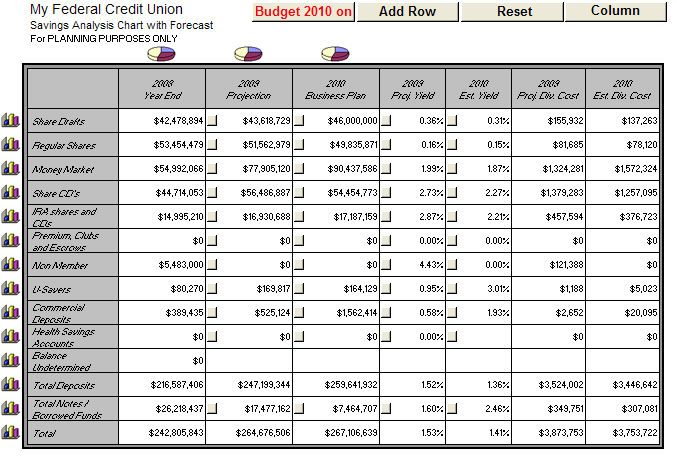
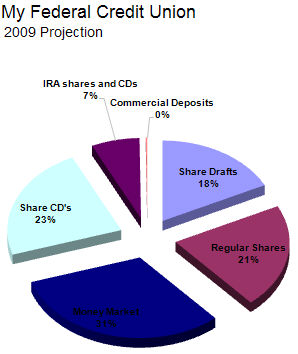
The Savings Analysis chart also contains a variety of graphs to help you visualize the status of Share accounts and progress.
The graph icons on the left side of the chart result in charts that will help you to track your progress in each Savings account category compared to Savings projections and goals you have entered.
The graph icons on the top of the chart result in charts that track distribution of loans through different accounts.
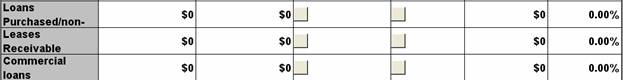
On the Loan Analysis chart, you can enter year end goals for all of your Loan balances, including credit card balances, unsecured loans, new and used vehicle loans, first mortgage loans, other real estate loans, other loans to members, leases receivable, and loans to non-members. You can also enter estimated year end yields (average weighted interest rate) for each of these Loan accounts.
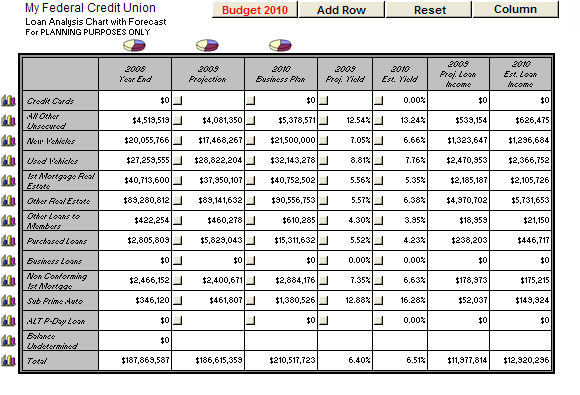
The Loan Analysis chart also contains graphing options to help you visualize the status of loan accounts and progress towards goals.
The graph icons on the left side of the chart result in charts that will help you to track your progress in each loan account category compared to loan projections and goals you have entered.
The graph icons on the top of the chart result in charts that track distribution of loans through different accounts.

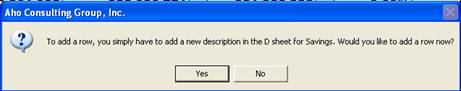
You can create additional product categories on the L and S sheets by clicking on the Add Row button that now appears in the top right hand corner of each sheet.
![]()
After clicking on ”Add Row” Insight will prompt you to add a corresponding row to the D sheet.
Insight relocates your cursor to an appropriate blank on the D sheet, where you can create a new category.
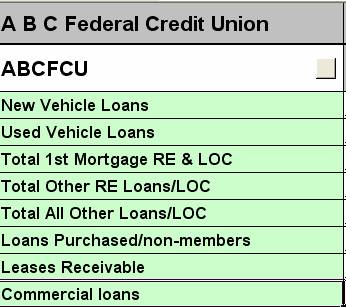
After you enter the new product category on the D sheet, Insight creates a corresponding category on the L or S sheet.