The Income Statement also shows detailed projections for the next five years.
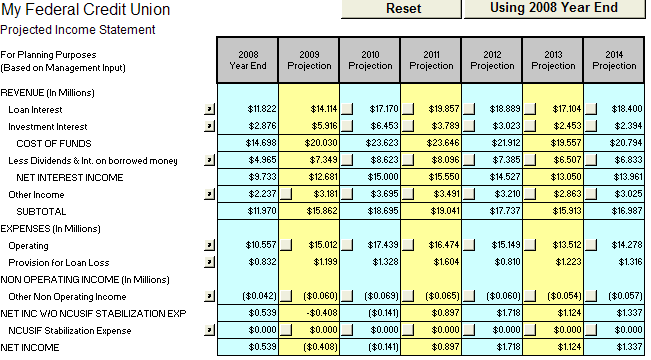
Again, you can run these projections using either last year end data, current year-to-date data, current year Business Plan data, current year Projection data (when entered), or next year’s Business Plan data (when entered) for running these projections. You select the figures you would like to use by clicking on the toggle button located on the top right hand side of the worksheet. If you have not yet entered certain Business Plan or Projection data, you will not see these options. The program determines if the information has been entered before displaying the related options.
A Reset button is also located at the top of the worksheet. This button will reverse any changes that you make in the 5 year sheet, restoring your original data and figures.
Notice the gray reference buttons (with question marks) adjacent to the categories that run down the left hand side of the Income Statement.
![]()
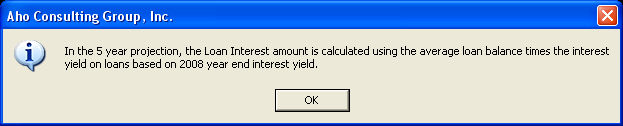
These reference buttons explain how each item is calculated. For example, clicking on the reference button next to the Loan Interest line item will result in the following item:
Let's take a look at where the data on the IN-5 YR Sheet comes from. Look at the Other Income projection for 2014 on the In-5yr sheet. It shows $2.8M.
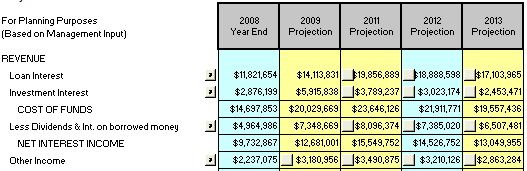
Notice that this user has chosen to use the 2009 Business Plan data for projections (Notice the ”Using the 2008 Business Plan” button, between the Reset button and column Options button at the top of the chart. The user could also use to choose her 2008 Year End figures or 2009 YTD balances for projections.)
This is the same percentage to average assets that the user entered for Other Income on the Income Statement. Insight is merely projecting the figure across to 2009.
The user has the ability to change this projection on the IN-5YR sheet by clicking on the gray button next to the projected dollar amount, and entering a more accurate figure. Notice that this changes the percentage to average assets as well.
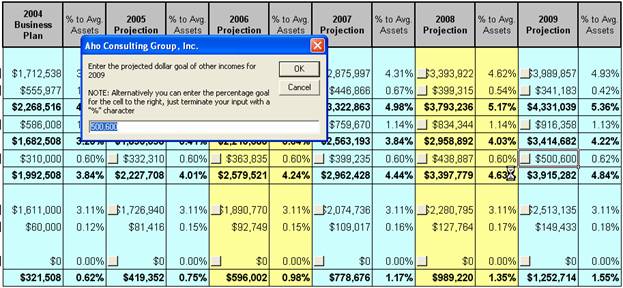
Insight assumes that you want to use the same percentage for each year, but if this is not the case, you will need to manually change the figures.
See Also: