This Balance Sheet shows detailed projections for the next five years.
You can use year end, year-to-date, current Business Plan or current year Projection data as the start point for the 5-year projections. If you have not yet developed a Business Plan or projected the credit union’s data to year end, you will not see these options. Insight will determine if the information has been entered before displaying the related options. You can select the data you would like to use for the beginning point of the 5 years, by clicking on the toggle button located on the top right hand side of the worksheet, next to the Reset button. All fields with input boxes are for you to make changes to the default assumptions.
The Reset button will reverse any changes that you make in the 5 year sheet, restoring your original data and figures.
Notice the gray reference buttons (with question marks) adjacent to the categories that run down the left hand side of the Balance Sheet?
![]()
These reference buttons explain how each item is calculated. For example, when the reference button next to the Cash line item is selected, the following item appears:
Let's take a look at where the data on the 5 YR Balance Sheet comes from. Look at the Total Assets projection for 2014 on the F-5yr sheet.
This figure is pulled from the 2014 Asset Growth projection in the middle column of the Asset Growth Rate section of the Growth Chart.
If you would like to increase asset size, change the growth percentage in this area of the growth chart.
Tip: You can use the "To Growth Chart" button to experiment with different asset growth percentages, and then press the Esc key on your keyboard to return to the F-5yr sheet.
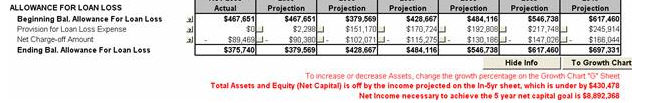
The red print on the bottom of the F-5yr sheet (shown below) will not be visible when the worksheet is printed. This information is provided only as a reference for the user.
The F-5YR chart now will issue a warning when the credit union’s Assets and Equity (Net Capital) are off. It is necessary that you adjust the income statement so that the ROA necessary to achieve the credit union's 5 year Growth Chart goals match the projected income statement. The default figures for the Income Statement simply maintain the same percentage to assets of the figures being used for the projection (actual data, current and future year’s projection data, etc.), which very likely will not achieve the Growth Chart goals.