These are the specialized viewing options. Each option is explained below.
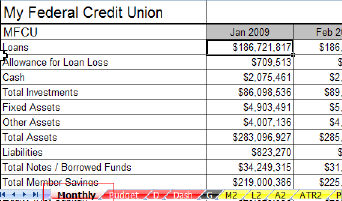
Display monthly data entry sheet
When this option is checked, the Monthly data entry sheet is displayed. The Monthly data entry sheet stores the monthly data typically entered on the D sheet. You can make changes to monthly data or enter monthly data within this sheet.
Display last year's monthly data entry sheet
When this option is checked, the previous year's Monthly data entry sheet is displayed and available for editing.
Display Charts for previous years (M1 - FT1)
When this feature is turned on, you can review the M1 - FT1 sheets which are currently hidden by default.
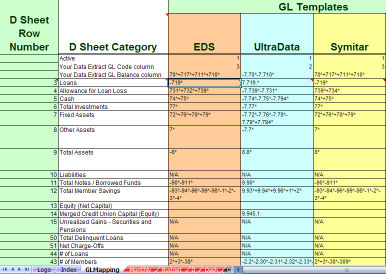
Display GL Transfer Mapping
When this feature is turned on, the Gl Transfer Mapping sheet is displayed, and you can edit the sheet as needed. To hide the sheet, deselect the checkmark next to this option.
Display values in dollars (not millions)
When this feature is turned on, Insight will display all values in dollars instead of millions. This is recommended for credit unions who are under 10 million in assets.
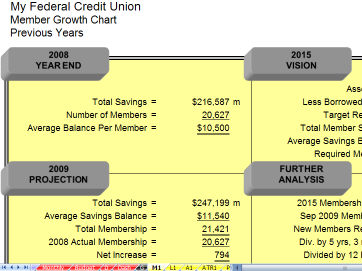
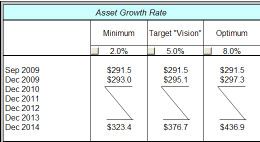
Show all values in Growth Chart
When this option is turned on, the growth chart will display all dollar amounts for each planning year.
With Show all values option off

With Show all values option on
Display Data Tables in Charts
This option will display corresponding data tables on each Chart.
With Display data table option on
Show yellow shading in sheets
Deselecting this option will remove the yellow shading from each sheet, for ease of printing/viewing.
Show sheet tab colors
Deselecting this option will remove the color coding from the sheet tabs.
![]()
With Show sheet tab colors off
![]()
With Show sheet tab colors on