You can make changes to the attributes and colors of any graph. The graphs themselves are no longer password protected, so you can point, click, and edit just as you would with any Excel chart. The data is still protected, but the graph itself is not.
You will need to unprotect the graph area first by clicking on the graph, and then going to Tools, Protection, and then Unprotect Sheet. You will not have to enter a password - the graph will unlock without a password.
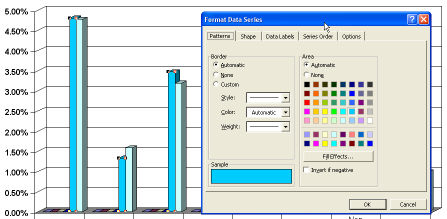
After unprotecting the sheet, you can right-click on the part of the graph you would like to change, and then select the appropriate formatting option from the menu that appears.
 .
.