Purpose of the M Chart
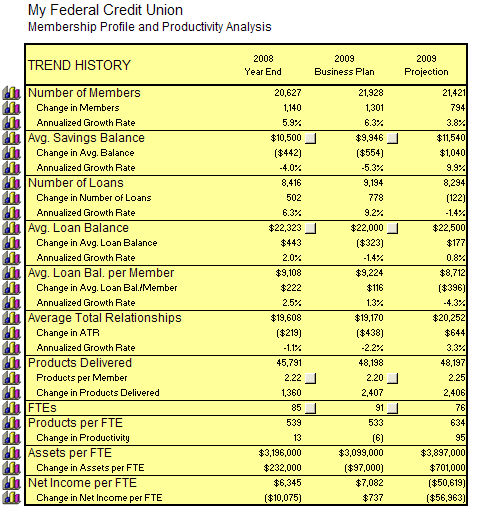
The purpose of this chart is to summarize the changing profile of the credit union. The chart captures the prior years’ trends, as well as the projected change based on achieving current planning year objectives. The chart tracks change in members, average savings balances, number of accounts, number of loans, average loan balance per loan, products per member, products delivered per FTE, assets managed per FTE, and the ROA produced per FTE.
Completing the M Worksheet
The data to calculate the changes indicated above are provided by the system. If desired, you can change certain data (for example, the average savings balance goal, the average loan balance goal, etc.) by clicking on the gray data entry buttons.